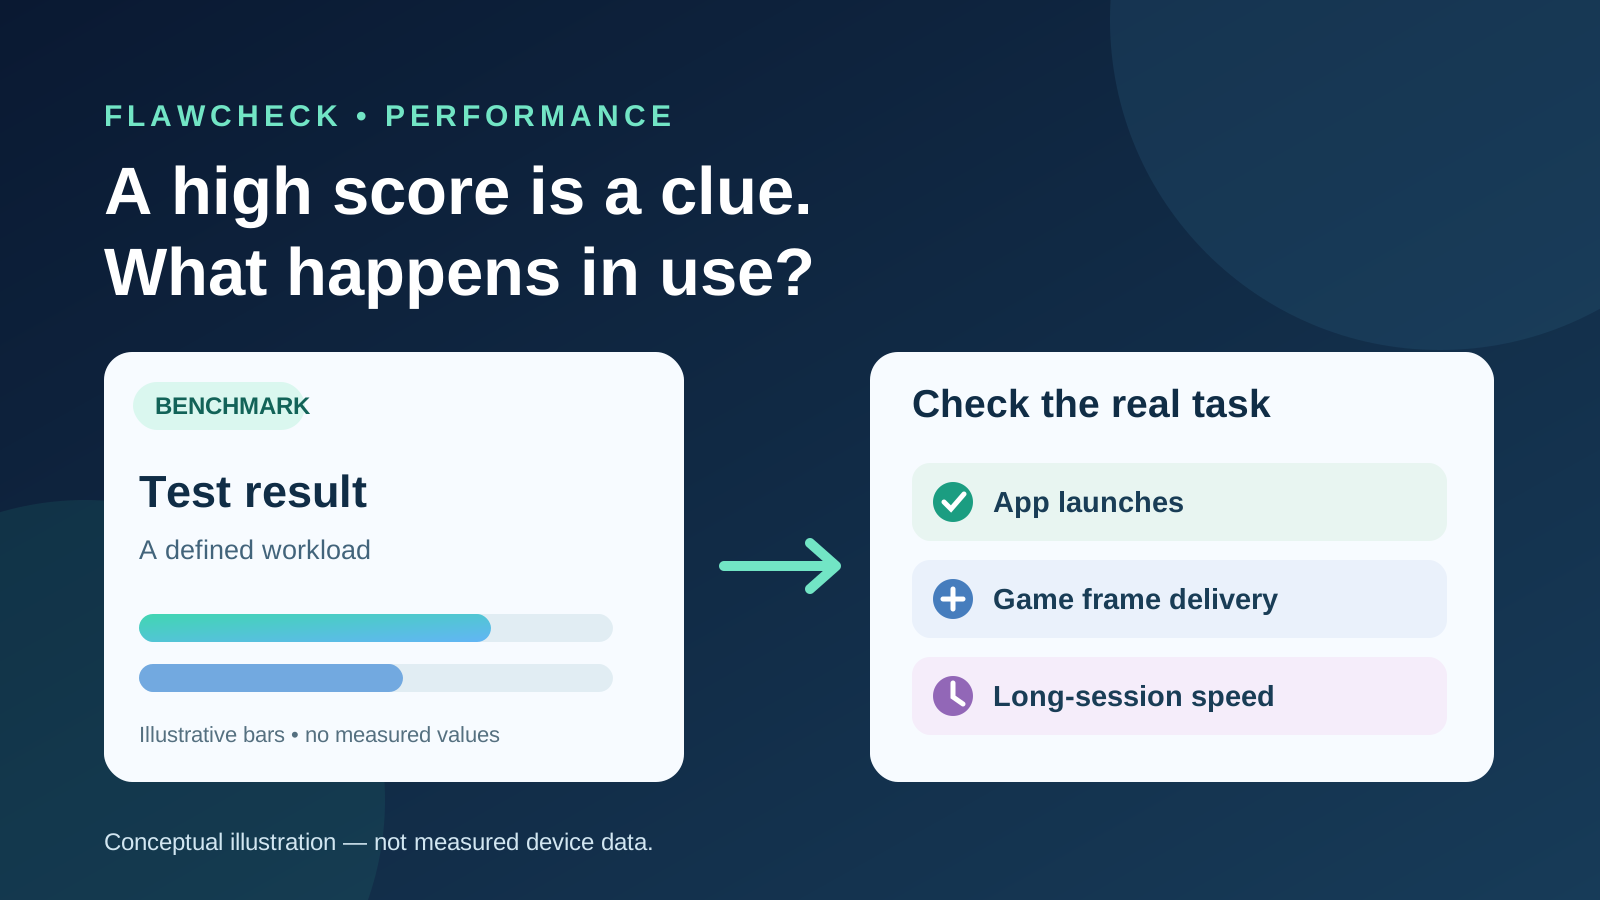
A phone leads in a benchmark. Will it open your apps faster, keep a game smoother, or feel better after years of use? The score alone cannot answer those questions. It tells you how the phone performed in that test, under those conditions. The useful next step is to ask whether the test stresses the part of the phone and the length of time you actually care about.
If your game reports high FPS but still feels uneven, use our phone game stutter checklist to separate timing, connection and session-length symptoms before upgrading.
Quick answer: Are phone benchmarks reliable?
Yes, for a defined measurement—when you compare the same test and version under similar conditions. No single score is a reliable verdict on the whole phone. A repeatable CPU result can reveal a meaningful difference in the benchmark’s CPU workloads. It does not measure every app’s launch sequence, background-app retention, gaming frame times, battery use, or how long the phone holds its initial speed.
“Reliable” has three layers. Repeatability asks whether reruns under similar conditions give reasonably consistent results. Relevance asks whether the workload resembles the task you care about. Transfer asks whether the measured advantage also appears in a real app or game. A benchmark can pass the first test and still be a weak answer to the other two. UL Solutions advises testing devices in the same environment and repeating runs where results vary; background activity and heat can shift mobile scores. UL mobile benchmarking guidance
The buying rule is straightforward: use the score to identify a capability worth investigating, then look for a test of the actual experience. If your priority is gaming, a graphics benchmark, a longer stress run, and frame-time observations in your game tell you more together than a CPU score alone. Our Snapdragon vs MediaTek comparison shows why separate game versions and phone configurations cannot establish a brand winner. If you mostly message, browse, and switch apps, responsive launches and retention matter more than a leaderboard win.
For the wider question of why two phones with different chips can feel alike—or the same chip can feel different—start with What Makes a Phone Fast?. This guide concentrates on how to interpret the numbers offered as evidence.
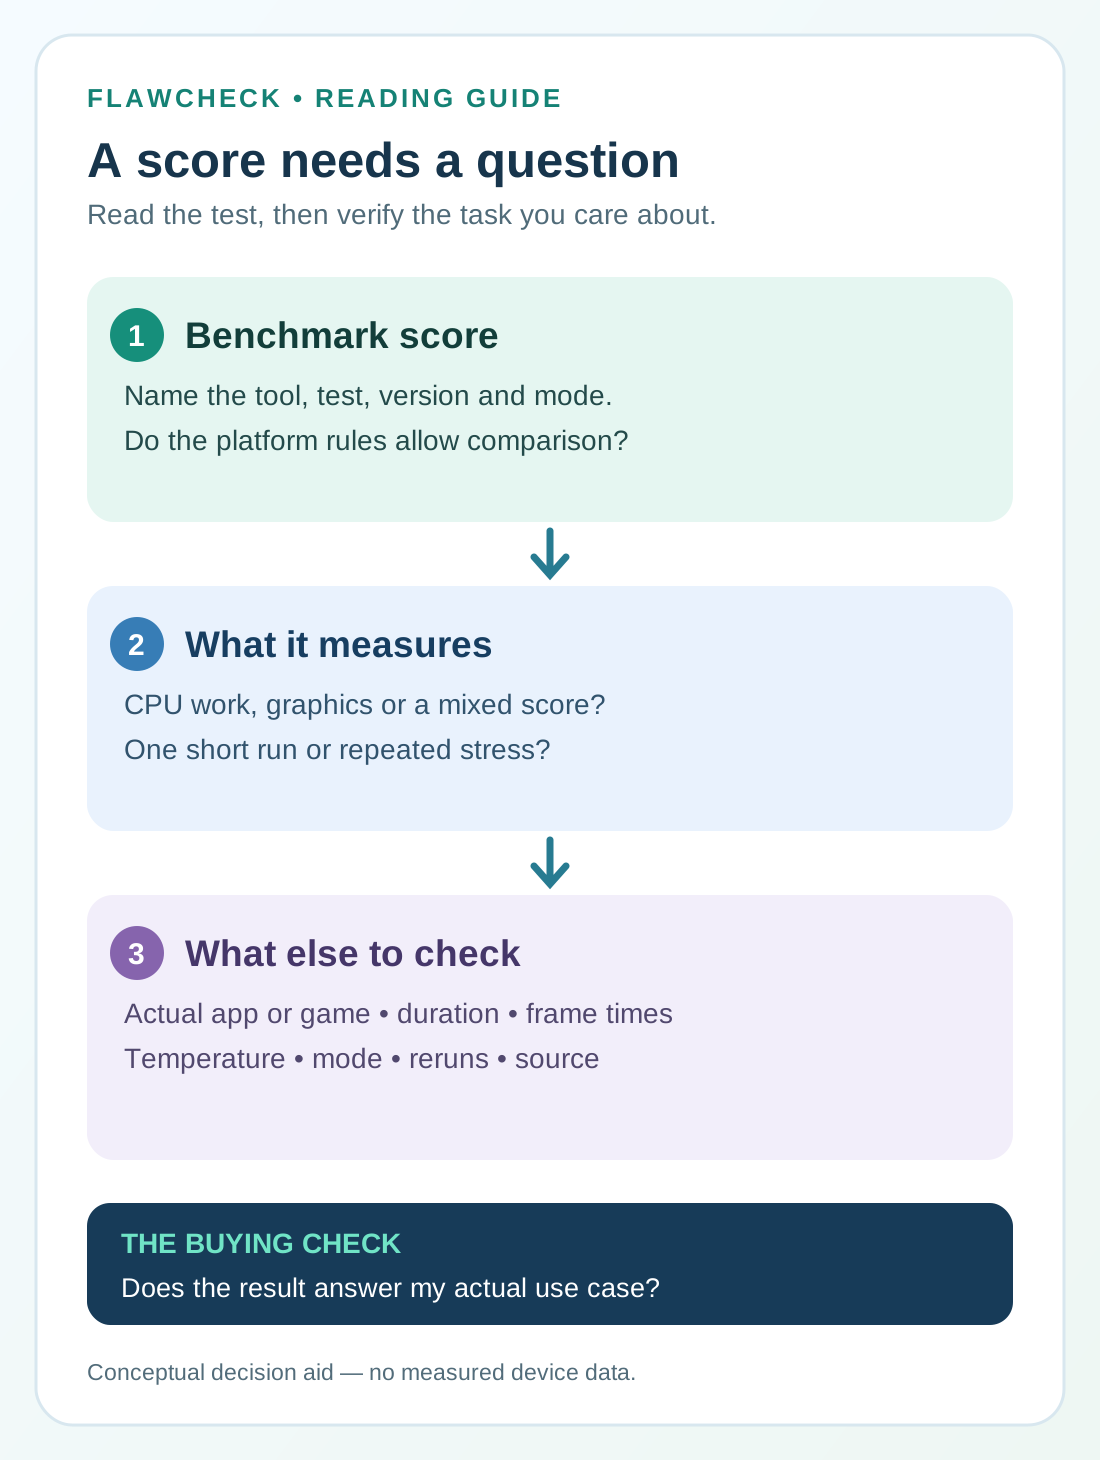
Benchmark score → what it measures → what else to check. Conceptual decision aid, not measured device data; scroll sideways on a narrow screen.
Evidence note: This is a research-based interpretation guide. FlawCheck has not run a controlled comparison of the illustrative phones below. The examples explain how to interpret metrics; they are not measured device results.
What does a benchmark score actually measure?
A benchmark runs a defined collection of tasks, records their outcomes, and reports one or more scores. The number is relative to that tool’s scoring system, not a universal unit of phone speed. A CPU test stresses computation; a GPU or graphics test stresses a different path; a broader system test blends categories. Even two CPU benchmarks can weight different workloads and produce different rankings.
This matters whenever a result is summarized as “Phone A is faster.” Faster at which test? A single-core result and a multi-core result answer different questions. Neither is a direct stopwatch reading for every app. For Android app startup, the platform distinguishes cold, warm, and hot starts, and measures both the first display and the fully drawn state. A reviewer who times a cached return to an app is not measuring the same event as a cold launch. Android Developers: app startup time
A composite score is especially easy to overread. A higher total can hide mixed sub-results: one device may lead in graphics, another in memory or user-experience tests. Before treating the overall winner as the better phone for you, inspect the component results and the task each component models. Our processor-specification guide covers why cores, clock speeds, process labels, and a chip name do not establish finished-phone performance.
Which test answers your question?
| Test | Useful for | Does not establish | Check alongside it |
|---|---|---|---|
| ◆ CPU single-/multi-core | Performance in specified CPU workloads | Every app’s launch time or gaming speed | Same-app cold/warm launch tests |
| ◆ GPU/graphics | Output in a named graphics workload | FPS in every game and setting | Game FPS and frame times |
| ◆ Composite system | A tool’s weighted mix of categories | That every component is better | Sub-scores and relevant tasks |
| ◆ Graphics stress run | Change during that repeated test | An exact result in another game | Absolute output, curve, duration |
Geekbench, AnTuTu, and 3DMark answer different questions
Geekbench focuses on CPU and GPU workloads, with separate results. Geekbench 7, released in July 2026, added media and game-physics tasks and changed how its multi-core suite uses workloads. That makes the version number part of the result, not a detail to discard. A Geekbench CPU lead is evidence about that suite; its GPU Compute result is not a direct gaming FPS prediction. Primate Labs describes Geekbench 7 as designed for cross-platform comparisons within the benchmark’s framework. Primate Labs: Geekbench 7; Geekbench overview
AnTuTu reports a broad result built from CPU, GPU, memory, and UX categories. Its public ranking says the displayed result is an average of valid submissions for a model, not that model’s best run. It also warns that Android and iOS scores are not directly comparable because the implementations use different platform technologies. That is AnTuTu’s specific limitation, not a rule that invalidates every cross-platform test. AnTuTu has separately said V10 and V11 results cannot be compared; its September 2026 V12 public-beta announcement also warns against comparing scores across changed versions. AnTuTu ranking and methodology; AnTuTu on Android versus iOS; AnTuTu V12 beta announcement
3DMark offers named graphics workloads and stress-test variants. A quick Wild Life run reflects a short burst in that particular scene; the Wild Life Stress Test loops it for about 20 minutes to expose how performance changes under sustained load. Other 3DMark tests differ in graphics demands, so “3DMark score” without the exact test name is incomplete. UL recommends pairing default mobile benchmark runs with 20-minute stress tests when reviewing peak and sustained performance. UL: Wild Life overview; UL: reviewers’ guide
Do not convert one tool’s points into another tool’s points. Even within a tool, confirm the test, major version, platform rules, mode, and score type before comparing two numbers. A table that mixes Geekbench 6 with 7, AnTuTu V10 with V11 or V12, or different 3DMark scenes may look precise while answering no valid comparison question. Some minor-version updates preserve comparability—Primate Labs explicitly says Geekbench 6.7 is comparable with 6.3–6.6—so check the developer’s statement for the exact versions rather than assuming every update resets the scale. Primate Labs: Geekbench 6.7
Peak performance versus sustained performance
A short test asks how fast a phone can work for a short period. That can matter: brief computation is part of everyday use. A longer run asks what remains after workload and heat accumulate. A high opening score cannot tell you how far output will fall later. Conversely, a modest peak does not automatically mean a bad gaming experience if performance stays even at settings the user wants.
When reading a stress result, look at the best run, the later or lowest run, and the trajectory, not just a stability percentage. A phone can retain a larger share of a lower starting result while another delivers more absolute output later in the same test. Read the actual scores or FPS side by side before deciding which performed better under sustained load. Neither result predicts the frame times of every game. UL’s stress-test results distinguish performance over the run from a percentage stability indicator. UL: stress-test results
⚠️ A higher stability percentage does not automatically mean higher sustained performance. Compare the absolute score or FPS and the performance curve under the same workload as well.
For the mechanism, warning signs, and test conditions behind a slowdown, see our phone thermal-throttling guide. The benchmark decision here is narrower: do you have enough sustained evidence to support the specific claim you want to make?
Why can a higher-scoring phone still feel slower?
App launch is more than CPU calculation. A cold launch may involve starting a process, reading resources, initializing code, doing app work, and drawing a usable screen. A return to an app already in memory is a different sequence. Thus a higher CPU score gives a reason to investigate CPU-bound launch work, but it cannot promise that every app opens faster. Compare the same apps, same start state, and a meaningful endpoint such as fully drawn content. Android’s startup documentation describes those distinct states and measurements. Android Developers: app startup time
App switching depends on memory behavior. A phone that must reload a background app can feel less responsive than one that resumes it, even if the former wins a CPU test. RAM capacity, software policy, app behavior, and the sequence of apps all matter. This is why our Android RAM buying guide evaluates retention separately from a chip’s speed. Storage performance can also matter when a task actually reads or writes local data; the storage-interface label alone does not predict a whole phone’s responsiveness.
Smooth gaming is about when frames arrive as well as how many arrive. A high GPU score is useful screening evidence, but the game, graphics setting, resolution, frame-rate cap, thermal state, and software path can change the outcome. Uneven delivery may look like stutter despite a respectable average. Android’s frame-pacing guidance addresses inconsistent frame times and input latency; our 60Hz versus 120Hz guide separates the display’s refresh opportunity from the frames an app delivers. Android Developers: Frame Pacing
Finally, a slow page or feed may be waiting for a network response, and a recent update may temporarily change background activity. A benchmark result cannot diagnose those causes. Match the observed symptom to an appropriate test before buying a new phone on the strength of one score.
When do benchmark comparisons become misleading?
The Kirin comparison methodology shows why current chart labels, missing test builds and different regional software do not justify a continuous generation-growth chart.
The Dimensity comparison methodology keeps unknown test builds and unlike workloads separate. Its device observations are useful buying evidence without becoming a continuous generation-speed ranking.
The Exynos comparison methodology provides another example: missing historical builds and run conditions leave no approved cross-device chart group. Separate device observations can inform questions without becoming a continuous generation ranking.
Our Snapdragon generation evidence method keeps Geekbench families, original reviewers and reference devices separate. Missing run conditions remain unknown rather than becoming a continuous chip ranking.
Example 1: Phone A has a higher CPU score. Suppose A leads B in the same Geekbench CPU test. You may say A led in that test. You may not conclude that every app opens faster. Ask whether a review timed the same app and start state on retail units, whether the phone keeps apps resident, and whether the difference persists through several launches.
Example 2: Phone B has higher stress-test stability. Read its starting and later absolute scores or FPS, test name, duration, and curve before calling it the stronger gaming phone. A high percentage can belong to a lower starting performance level. Then look for a sustained test of the game and settings you use. Retention and absolute output must be read together.
Example 3: Two reviewers report different scores for the same model. First check the exact storage/RAM variant, firmware, benchmark and version, test mode, ambient conditions, starting temperature, battery/charging state, and whether each number is one run, a best run, or an average. Repeated tests can differ even on one device. UL recommends comparable conditions and additional runs when a device’s results are inconsistent. Do not average together reports with mismatched methods or declare one reviewer wrong solely because the numbers differ. UL mobile benchmarking guidance
A screenshot of a high score without a method, device variant, and source is weak evidence. A launch presentation measures a different level of certainty from an attributed retail-unit review. If a manufacturer or reviewer provides unusually favorable results, the useful response is to seek reproducible conditions and independent tests, not to label the result dishonest without proof.
A score may favor a former flagship while the purchase still turns on battery condition, remaining updates and price. Our old flagship versus new mid-range guide puts that performance evidence into a same-budget buying decision.
Our Apple A-series benchmark comparison limits show why a chart cannot simply join Geekbench 5, 6 and 7. The guide keeps the newer CPU results separate by original tester and leaves unverified run details explicit.
How to use benchmarks before buying a phone
Start with the activity you want to improve. Then follow the evidence in this order:
The six-label result check: 🏷️ Version · 🧪 Workload · ⚙️ Mode · 🌡️ Temperature/conditions · 🔁 Number of runs · 🔗 Source. If a review omits one, treat the comparison with appropriate caution.
- Identify the bottleneck. Is your concern slow app launches, background reloads, gaming, editing/exporting, or long sessions? Do not let a CPU chart answer a memory-retention question.
- Match the test. Look for CPU results for CPU workloads, a named graphics test for graphics capacity, and a sustained run for prolonged load. For gaming, seek actual game FPS and frame-time observations at stated settings.
- Check comparability. Confirm benchmark name, version, test mode, platform rules, phone variant, firmware, and performance settings. Reject a direct numerical comparison when the tool says its scoring systems differ.
- Inspect the distribution and duration. Prefer repeated results or disclosed averages over one unusually high run. For stress tests, read absolute output along with retention and the performance curve.
- Check the real task and trade-offs. A useful review discloses the exact app or game, settings, duration, temperature or environment, and battery/charging state. Consider heat, battery drain, noise from an active cooling accessory, or aggressive power mode when they are part of the tested result.
For a light user, a recent phone that handles your apps reliably may offer little practical return from paying for the highest peak score. For a gamer, consistent frame delivery in the games you play deserves more weight. For someone recording long video or doing lengthy edits, look for sustained tests of that workload and the finished phone—not only its processor’s ranking. These are decision rules, not universal score thresholds or guarantees about years of future performance.
Verdict
Phone benchmarks are useful instruments, but each instrument has a job. Trust a well-described score as evidence of performance in its named workload. Before turning it into a buying verdict, ask whether the comparison is valid, whether the advantage holds over the relevant duration, and whether a task-level test confirms a benefit you will notice. A small lead without those answers is a reason to investigate, not a reason to pay more.